Previous sections in this module have covered the basics of raster layers with OpenLayers. This section deals with vector layers - where the data is rendered for viewing in your browser.
OpenLayers provides facilities to read existing vector data from the server, make modifications to feature geometries, and determine how features should be styled in the map.
Though browsers are steadily improving in terms of JavaScript execution speed (which helps in parsing data), there are still serious rendering bottlenecks which limit the quantity of data you’ll want to use in practice. The best advice is to try your application in all the browsers you plan to support, to limit the data rendered client side until performance is acceptable, and to consider strategies for effectively conveying information without swamping your browser with too many vector features (the technical vector rendering limits of your browser often match the very real limitations of your users to absorb information).
Let’s go back to the WMS example to get a basic world map. We’ll add some feature data on top of this in a vector layer.
Tasks
Open maps.html in your text editor and copy in the contents of the initial WMS example. Save your changes and confirm that things look good in your browser: http://localhost:8080/ol_workshop/map.html
In your map initialization code (anywhere after the map construction), paste the following. This adds a new vector layer to your map that requests a set of features stored in GeoRSS:
var earthquakes = new OpenLayers.Layer.Vector("Earthquakes", {
    strategies: [new OpenLayers.Strategy.Fixed()],
    protocol: new OpenLayers.Protocol.HTTP({
        url: "data/layers/7day-M2.5.xml",
        format: new OpenLayers.Format.GeoRSS()
    })
});
map.addLayer(earthquakes);
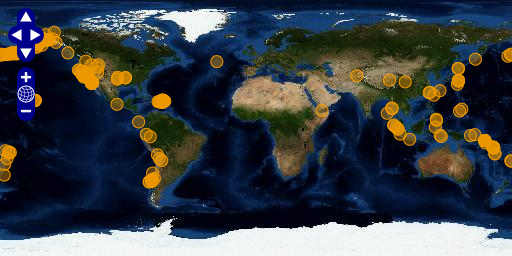
World map with orange circles representing earthquake locations.
Let’s examine that vector layer creation to get an idea of what is going on.
var earthquakes = new OpenLayers.Layer.Vector("Earthquakes", {
    strategies: [new OpenLayers.Strategy.Fixed()],
    protocol: new OpenLayers.Protocol.HTTP({
        url: "data/layers/7day-M2.5.xml",
        format: new OpenLayers.Format.GeoRSS()
    })
});
The layer is given the title "Earthquakes" and some custom options. In the options object, we’ve included a list of strategies and a protocol. A full discussion of strategies and protocols is beyond the scope of this module, but here is a rough sketch of what they do:
In this case, we’re using a fixed strategy. The fixed strategy triggers a single request for data and doesn’t ever ask for updates. We’re asking for data using the HTTP protocol, we provide the URL for the data, and we expect the features to be serialized as GeoRSS.
Bonus Tasks