So far we have been using WMS to render raster images and overlay them in OpenLayers. We can also pull features as vectors and draw them on top of a base map. One of the advantages of serving vector data is that users can interact with the data. In this example, we create a vector layer where users can select and view feature information.
Tasks
Let’s start with the working example from the previous section. Open map.html in your text editor and make sure it looks something like the following:
<html>
    <head>
        <title>My Map</title>
        <link rel="stylesheet" href="openlayers/theme/default/style.css" type="text/css">
        <style>
            #map-id {
                width: 512px;
                height: 256px;
            }
            #scaleline-id {
                margin: 10px;
                font-size: xx-small;
            }
            </style>
        <script src="openlayers/lib/OpenLayers.js"></script>
    </head>
    <body>
        <h1>My Map</h1>
        <div id="map-id"></div>
        <div id="scaleline-id"></div>
        <script>
            var medford = new OpenLayers.Bounds(
                4284890, 253985,
                4288865, 257980
            );
            var map = new OpenLayers.Map("map-id", {
                projection: new OpenLayers.Projection("EPSG:2270"),
                units: "ft",
                maxExtent: medford,
                restrictedExtent: medford,
                maxResolution: 2.5,
                numZoomLevels: 5
            });

            var base = new OpenLayers.Layer.WMS(
                "Medford Streets & Buildings",
                "/geoserver/wms",
                {layers: "medford"}
            );
            map.addLayer(base);

            var scaleline = new OpenLayers.Control.ScaleLine({
                div: document.getElementById("scaleline-id")
            });
            map.addControl(scaleline);

            map.zoomToMaxExtent();
        </script>
    </body>
</html>
Next add a vector layer that requests the building footprints for Medford, Oregon. Because this data will be rendered client-side (i.e., by your browser), users can interact with its features. Somewhere in your map initialization (after the map object is created), add the following code to create a vector layer that uses the WFS protocol:
var buildings = new OpenLayers.Layer.Vector("Buildings", {
    strategies: [new OpenLayers.Strategy.BBOX()],
    protocol: new OpenLayers.Protocol.WFS({
        version: "1.1.0",
        url: "/geoserver/wfs",
        featureType: "buildings",
        featureNS: "http://medford.opengeo.org",
        srsName: "EPSG:2270"
    })
});
map.addLayer(buildings);
With the buildings layer requesting and rendering building features, we can create a control that allows users to select buildings. In your map initialization code, add the following after the creation of your buildings layer:
var select = new OpenLayers.Control.SelectFeature([buildings]);
map.addControl(select);
select.activate();
Save your changes to map.html and open the page in your browser: http://localhost:8080/ol_workshop/map.html. To see feature selection in action, use the mouse-click to select a building:
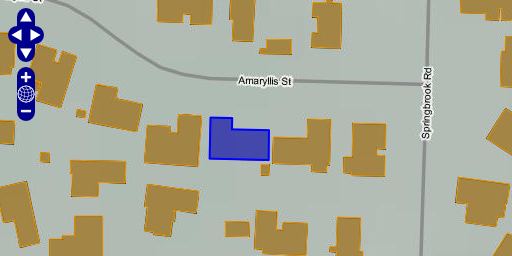
Using a control to select features from a vector layer.
We can use layer events to respond to feature selection. This is useful for displaying specific feature information to the user. The featureselected event is triggered on a vector layer each time a feature is selected. Here we add a listener for this event that will display feature information below the map.
Tasks
First we need to add an element to display the feature information. Open map.html in your text editor and insert the following markup into the <body> of your page.
<div id="output-id"></div>
Next we add some style declarations so that the feature information output doesn’t sit on top of the scale bar. Give your output element some margin, by adding the following within the <style> element:
#output-id {
    margin: 10px 250px;
}
Finally, we create a listener for the featureselected event that will display feature information in the output element. Insert the following in your map initialization code after the creation of the buildings layer:
buildings.events.on({
    featureselected: function(event) {
        var feature = event.feature;
        var area = feature.geometry.getArea();
        var id = feature.attributes.key;
        var output = "Building: " + id + " Area: " + area.toFixed(2);
        document.getElementById("output-id").innerHTML = output;
    }
});
Save your changes and refresh the map.html page in your browser: http://localhost:8080/ol_workshop/map.html
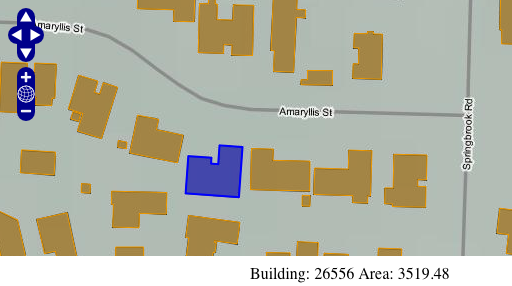
Displaying building information on feature selection.