Online maps often contain a smaller overview map that displays the extent of the larger map. In OpenLayers, this is possible using the OpenLayers.Control.OverviewMap control.
Let’s create a map with a single layer and then add an overview map control.
Tasks
Open a text editor and save the following page as map.html in the root of your workshop directory:
<html>
    <head>
        <title>My Map</title>
        <link rel="stylesheet" href="openlayers/theme/default/style.css" type="text/css">
        <style>
            #map-id {
                width: 512px;
                height: 256px;
            }
        </style>
        <script src="openlayers/lib/OpenLayers.js"></script>
    </head>
    <body>
        <h1>My Map</h1>
        <div id="map-id"></div>
        <script>
            var medford = new OpenLayers.Bounds(
                4284890, 253985,
                4288865, 257980
            );
            var map = new OpenLayers.Map("map-id", {
                projection: new OpenLayers.Projection("EPSG:2270"),
                units: "ft",
                maxExtent: medford,
                restrictedExtent: medford,
                maxResolution: 2.5,
                numZoomLevels: 5
            });

            var base = new OpenLayers.Layer.WMS(
                "Medford Streets & Buildings",
                "/geoserver/wms",
                {layers: "medford"}
            );
            map.addLayer(base);

            map.zoomToMaxExtent();
        </script>
    </body>
</html>
Open the working map in your web browser to confirm things look good: http://localhost:8080/ol_workshop/map.html.
We are now going to add an overview map with default options to confirm things are properly working. Somewhere in your map initialization code (after the creation of the map object), insert the following:
var overview = new OpenLayers.Control.OverviewMap({
    mapOptions: {
        projection: new OpenLayers.Projection("EPSG:2270"),
        units: "ft",
        maxExtent: medford,
        restrictedExtent: medford,
        maxResolution: 22,
        numZoomLevels: 5
    }
});
map.addControl(overview);
Save your changes and refresh map.html in your browser: http://localhost:8080/ol_workshop/map.html
To see the overview map in action, open the plus sign at right of the map viewport.
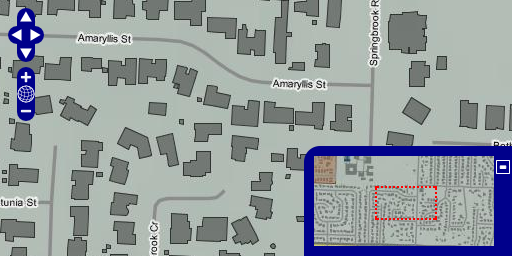
An overview map control inside the main map viewport.
The map in this example includes a few things you may not have seen before:
var medford = new OpenLayers.Bounds(
    4284890, 253985,
    4288865, 257980
);
var map = new OpenLayers.Map("map-id", {
    projection: new OpenLayers.Projection("EPSG:2270"),
    units: "ft",
    maxExtent: medford,
    restrictedExtent: medford,
    maxResolution: 2.5,
    numZoomLevels: 5
});
First, we construct the map in a custom projection. The OpenLayers default is to contruct maps in a geographic projection, with units in decimal degrees. Because of the nature of the Medford dataset, we define a projection more appropriate for this area (i.e., Oregon State Plane South). This change in projection also requires setting the map units to feet (“ft”).
The second thing to note is the use of the restrictedExtent property. This optional property restricts map panning to the given bounds. The imagery data used by the medford layer is limited to these bounds. To keep users from panning off the edge of our base layer, we set the restrictedExtent to the bounds of the data.
The final set of custom options are related to map resolutions. By default, a map will be set up to view the entire world in two 256x256 tiles when all the way zoomed out. Since we want to focus on a very limited subset of the world, we set the maxResolution property. A value of 2.5 means 2.5 feet per pixel (since we set map units to feet). When users are zoomed all the way out, they will be seeing 2.5 feet per pixel. We also specify that we only want 5 zoom levels instead of the default 16 levels.
The overview map constructor also deserves a bit of discussion:
var overview = new OpenLayers.Control.OverviewMap({
    mapOptions: {
        projection: new OpenLayers.Projection("EPSG:2270"),
        units: "ft",
        maxExtent: medford,
        restrictedExtent: medford,
        maxResolution: 22,
        numZoomLevels: 5
    }
});
map.addControl(overview);
Like the custom map above, customization to the overview map control must also be specified. So, for every non-default property set for the main map, we need a corresponding property for the map created by the control.
We want projection, units, restrictedExtent and numZoomLevels to be the same for the overview map as well as the main map. However, in order for the overview map to zoom “farther out” we want a different maxResolution property. The appropriate values for your application can be determined by trial and error or calculations based on how much data you want to show (given the map size).
Next we’ll build upon our map to include a scale bar.