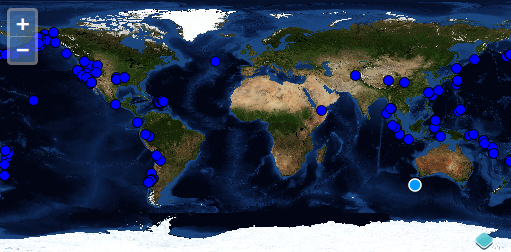
Neue Features kann man mittels einer ol.interaction.Draw zeichnen. Eine solche Draw-Interaktion benötigt beim initialisieren eine Vektor-source und einen Geometrietyp.
Übungen
Wir beginnen mit dem unten aufgeführten Beispiel. Öffnen Sie die Datei map.html im Texteditor und stellen Sie sicher, dass der Inhalt etwa wie folgt aussieht.
<!doctype html>
<html lang="en">
  <head>
    <link rel="stylesheet" href="ol3/ol.css" type="text/css">
    <style>
    #map {
      height: 256px;
      width: 512px;
    }
    </style>
    <script src="ol3/ol.js" type="text/javascript"></script>
    <title>OpenLayers 3 example</title>
  </head>
  <body>
    <h1>My Map</h1>
    <div id="map"></div>
    <script type="text/javascript">
      var source = new ol.source.GeoJSON({
        url: 'data/layers/7day-M2.5.json'
      });
      var draw = new ol.interaction.Draw({
        source: source,
        type: 'Point'
      });
      var map = new ol.Map({
        interactions: ol.interaction.defaults().extend([draw]),
        target: 'map',
        layers: [
          new ol.layer.Tile({
            title: "Global Imagery",
            source: new ol.source.TileWMS({
              url: 'http://maps.opengeo.org/geowebcache/service/wms',
              params: {LAYERS: 'bluemarble', VERSION: '1.1.1'}
            })
          }),
          new ol.layer.Vector({
            title: 'Earthquakes',
            source: source,
            style: new ol.style.Style({
              image: new ol.style.Circle({
                radius: 5,
                fill: new ol.style.Fill({
                  color: '#0000FF'
                }),
                stroke: new ol.style.Stroke({
                  color: '#000000'
                })
              })
            })
          })
        ],
        view: new ol.View({
          projection: 'EPSG:4326',
          center: [0, 0],
          zoom: 1
        })
      });
    </script>
  </body>
</html>
Speichern Sie Ihre Änderungen und laden Sie die Seite im Browser neu: http://localhost/ol3-ws/map.html
Klicken Sie mit der linken Maustaste auf die Karte, um neue Features hinzuzufügen.

Featureerzeugung mittels einer Draw-Interaktion.
Zusatzaufgabe